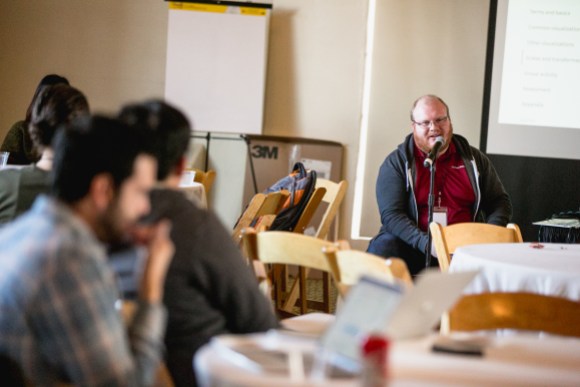
Working at an organization built around making knowledge free and accessible is profoundly inspiring. So when our All Hands[1] organizers solicited for workshops, I decided it was time to share my knowledge about data visualization.
If you’ve ever wondered, “When do I use a pie chart vs. when should I use a scatter plot, and what do these mean for my intended audience?,” then this website is for you. I wanted to share the tools and vocabulary that empowers them to look at statistical graphics and see what I see.
You can see the site over in our testing labs. I used RStudio’s learnr and rmarkdown packages to create the lesson, which includes a think-pair-share group activity and a quiz for self-assessment.
The website runs on RStudio‘s Shiny Server and is hosted on Wikimedia Cloud VPS, run by the Wikimedia Cloud Services team. It is open sourced on GitHub. If you don’t care about bells and whistles, there is a simple, static web page version that has all of the content without the self-assessment quiz.
If you find it useful and informative, please let us know! If you would love to see more resources like this, please let us know that as well.
And if you’re on a data-driven team, do give the group activity a try together with your teammates.
Mikhail Popov, Data Analyst, Reading Product
Wikimedia Foundation
Footnotes
- “All Hands” is the Wikimedia Foundation’s annual gathering of its full-time staff, many of whom work remotely from locations around the globe. Interested in joining us? Check out our open positions.
Can you help us translate this article?
In order for this article to reach as many people as possible we would like your help. Can you translate this article to get the message out?
Start translation