
In April of this year, the Wikimedia Foundation’s Discovery Analysis team began migrating the setup for the Discovery Dashboards from Vagrant and a shell script to use a configuration language and framework called Puppet. Puppet is a technology used by the Wikimedia Foundation to manage machine configurations almost everywhere—from data centers to continuous integration infrastructure and analytics clusters. We decided to make the switch because the previous setup created unnecessary overhead and made the server difficult to maintain.
Under the guidance of our awesome embedded technical operations engineer, Guillaume Lederrey, we took it upon ourselves to learn Puppet, and learn Puppet we did.
In this post, I’ll talk a little about Discovery Dashboards, a set of dashboards used by teams like Search Platform and Wikidata Query Service to track various metrics. Then, I’ll describe the technologies involved—such as the programming language R, Shiny (a web application framework), and Vagrant (software that allows us to build and maintain portable virtual software development environments), before properly introducing Puppet and sharing our experience of learning it. Finally, this post concludes with an explanation of how the new configuration utilizes the r_lang and shiny_server modules, so that readers may use them in their own environments.
Discovery Dashboards
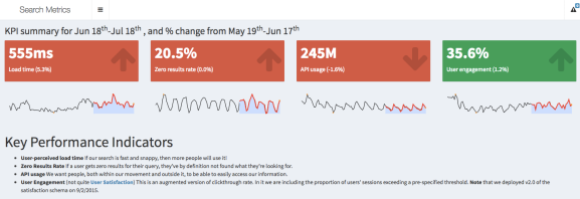
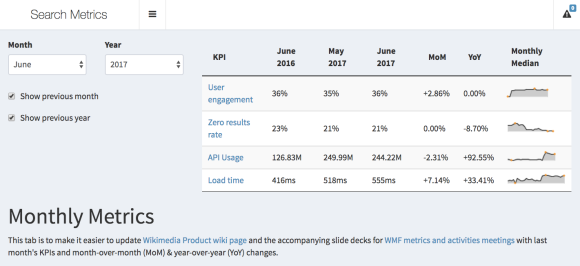
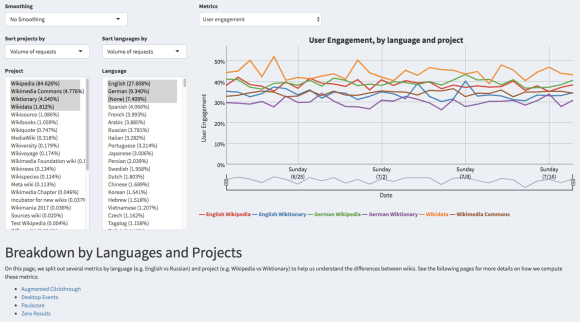
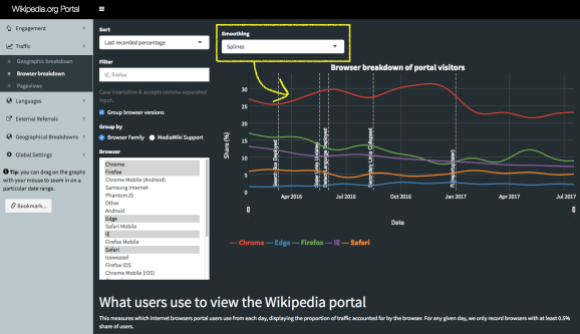
Our dashboards enable us and our communities to track various teams key performance indicators (KPIs) and other service/product usage metrics:
- Search Metrics dashboard includes metrics such as the zero results rate (the percentage of searches that don’t yield results), engagement with search results, search API usage, and a breakdown of traffic to Wikimedia projects from searches made on Wikipedia.
- Portal dashboards shows how many pageviews wikipedia.org gets on a daily basis (which is separate from how pageviews are tracked in general), breakdowns of traffic by browser and location, and which sections and languages visitors click on.
- Wikidata Query Service (WDQS) dashboard shows the volume of WDQS homepage visits and requests to the SPARQL and LDF endpoints.
- Wikimedia Maps dashboard allows the user to see the volume of tiles requested from Kartotherian maps tile server, broken down by style, zoom level, etc.
- External Referral Metrics dashboard breaks down our pageviews by referrer (source), such as “internal” (e.g. when you go from one Wikipedia article to another) and “external” (e.g. when you click on a Wikipedia article from a Google search results page). It also breaks down our search engine-referred traffic by search engine.
All of the dashboards’ source code is also available in full under the MIT license and all of the datasets are available publicly, including the scripts and queries we use to generate them. The dashboards are based on a web application framework called Shiny, which enables us to develop them in the statistical software and programming language R.
R/Shiny
For a very long time, a lot of the focus of R has been on data-related tasks (such as wrangling and visualizing), statistical modeling, machine learning, and simulation. After Shiny was released in 2012, it became possible to write web applications using nothing but R. These days we have packages for:
- Writing reproducible reports and academic articles with R Markdown
- Including interactive visualizations in documents and Shiny apps via htmlwidgets
- Running an HTTP server so you could have an R-powered API with plumber
- Writing a whole book with bookdown, creating a website with a blog via blogdown, and creating interactive tutorials through learnr
We built our dashboards with R and Shiny. We added interfaces for dynamically filtering and subsetting data, for applying scale transformations, and for smoothing the data using the language and tools we already use on a daily basis as part of our job as data analysts. Anything you can do in R, you can make available to the user.
You can include the code for forecasting, clustering, and model diagnostics in the same file where you’re defining the buttons to do those things. Shiny applications can be hosted on shinyapps.io or hosted yourself using the Shiny Server software, which is what we do because we have the hosting resources thanks to Wikimedia Cloud Services team. We host the applications that were previously managed through Vagrant applications on Wikimedia Labs.
Vagrant
Vagrant is a tool for building and managing virtual machine environments (VMs) and is used in combination with providers such as VirtualBox and VMware. Our previous configuration, which used Vagrant, involved launching an instance (a virtual machine) on Wikimedia Labs and create a Vagrant container that would then run Ubuntu and the Shiny Server software. This created an extra operating system (OS) virtualization layer. We realized we could reduce the amount of overhead by switching to a different solution. This was the initial solution when our first dashboard (the search metrics one) was just a prototype—a proof of concept for tracking and keeping a historical record of the team’s KPIs.
Over time, we started to run into some technical issues and the configuration made it difficult for others to help us. We also started to have security concerns because updating installed packages involved logging into the machines and manually performing the upgrade procedure. Even deploying new versions of the dashboards was a hassle. The answer was simple: Puppet. In one swoop, we could run the Shiny Server software directly on the Labs instance, we could make it easy for Ops to debug and repair our codebase if there are system administration-type problems, and we could give Ops control over the OS and essential configurations.
Puppet

We’ve actually written about Puppet and “Puppetization” of Wikimedia a few times before. Ryan Lane wrote about our Puppet repository when our Technical Operations (“Ops”) team made it public. In her summary of the New Orleans Hackathon 2011, Sumana Harihareswara wrote about our Ops team Puppetizing the caching proxy Varnish. Sumana also wrote a very thorough post about the Puppetization of our data centers.
What Puppet is
Luke Kanies provides the following succinct description of Puppet:
[It] is a tool for configuring and maintaining your computers; in its simple configuration language, you explain to [it] how you want your machines configured, and it changes them as needed to match your specification. As you change that specification over time—such as with package updates, new users, or configuration updates—Puppet will automatically update your machines to match. If they are already configured as desired, then [it] does nothing. (Excerpt from The Architecture of Open Source Applications, Vol. 2, released under the Creative Commons Attribution license.)
Depending on your library of modules, your Puppet configuration can have specifications such as a clone of a Git repository set to stay up-to-date or a cron job registered to a specific user. Suppose you have a package that needs to be built from source and links to a library like GSL or libxml2 but cannot download and install those libraries itself. When declaring that package, you can give Puppet a list of dependencies (of any resource type) that need to exist first, and Puppet takes care of making those dependencies available.
Learning Puppet
When we decided to switch to a Puppet-based configuration, we did not want to put the burden of migration on our embedded Ops engineer and instead saw an opportunity to learn an incredibly useful technology. Learning Puppet would mean that we would continue to have complete control over our dashboards and when we need to change something, we would have the knowledge to just do it ourselves. So instead, we asked Guillaume to be our guide and teacher. We would do the bulk of Puppetization and he would introduce us to Puppet, review our code, and show us how to test the patch.
Guillaume created some starter files for us to begin with and set Vagrant to use the Puppet provisioner. Having this setup enabled us to test locally with Vagrant. We could then write Puppet code responsible for installing an R package and run `vagrant provision` to see if it actually worked. At various milestones, we would upload our work for review and Guillaume would leave thorough feedback and criticism. Eventually, we were ready to work with Ops’ Puppet repository and we moved on to patching our stuff into that.
In addition to the official Puppet documentation, the following resources were especially useful in learning the new technology and, in some ways, the new philosophy:
- Getting Started With Puppet Code: Manifests and Modules by DigitalOcean
- Puppet CookBook: a collection of task oriented solutions in Puppet by Dean Wilson
- Learning Puppet with Vagrant by Sysadmin Casts
Something that helped me learn how to write Puppet code was using a lint checker in my text editor. A lint, or “linter,” is a utility that reads your code and checks the syntax against a set of language-specific rules in order to find parts of code that might lead to errors (such as a missing comma between function arguments) or stylistic issues (such as lines that exceed a certain maximum character length). For example, our Ops team has a style guide in addition to the official Puppet style guide that I could have had open on the side, but I found that as a beginner it was less mental overload to just have a utility that performs syntax checking in background.
Puppetization
You declare what your machine should have and do via resources—e.g. a user, a file, or an exec (execution of a command)—and once you have your configuration full of resource declarations, you can set a machine to be an instance of that particular configuration, and Puppet will take care of making that machine look and behave like you declared it should. Similar to functions and classes in programming languages, if a resource type you want to use does not exist yet, you can just create a new one.
In our case, we had to define what it means to be a Shiny server, which includes running RStudio’s Shiny Server software and having R packages. So we had to write the logic for installing R packages from Comprehensive R Archive Network, Gerrit, and GitHub. The result was the shiny_server module, which is available for anyone to use as part of our open source Puppet code repository. If you’re learning Puppet, we hope the following breakdown of our configuration may be of help.
At the highest level, we have two roles: a discovery::dashboards role (which utilizes the discovery_dashboards::production profile) and a discovery::beta_dashboards role (which utilizes the discovery_dashboards::development profile). You can refer to this article in Puppet’s documentation to get a better understanding of differences between profiles and roles.
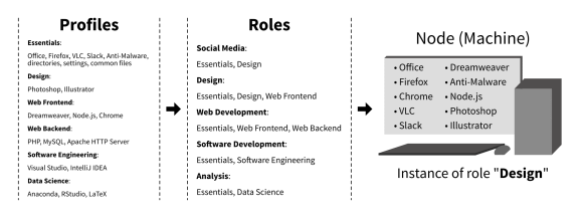
This diagram shows how one might use roles and profiles to configure their company’s computers in a reproducible, automated way. A node may only have one role, but that role may have multiple profiles. Adding or removing software in a profile will propagate to any roles that use that profile and to any computers that are instances of those roles.
The two dashboard profiles are where we clone the git repositories of our dashboards, the only difference being which remote branch is used. Specifically, the “development” profile pulls from the “develop” branch of each dashboard, which we use for testing out code refactors, new features, and new metrics. In contrast, the “production” profile pulls from the “master” branch—which is the stable version that we update once we’re satisfied with how the “develop” branch looks. It’s a common software engineering practice and is a simpler version of the branching model described by Vincent Driessen.
Both profiles include the discovery_dashboards::base profile, which is where we actually bring in the shiny_server module, copy the Discovery Dashboards HTML homepage, and list which R packages to install specifically for our dashboards. The shiny_server initialization file is what configures users/directories/services and installs Ubuntu & R packages, provides some resource types for installing R packages from different sources. While the Linux packages are installed using the existing code (require_package, rather than the built-in package resource in Puppet), we had to create the module r_lang for setting up the R computing environment (via this initialization file). The module provides some resources for installing packages from sources like CRAN and Git repositories (via r_lang::cran, r_lang::git, and r_lang::github), and it also includes a script for updating the library of installed R packages.
Because of the way we structured it, our team and other teams within the Foundation can write new profiles and roles that utilize shiny_server to serve other Shiny applications and even interactive reports written in RMarkdown that include Shiny elements.
Final remarks

The alternative, jocular title for this post was “I AM BECOME OPS…AND SO CAN YOU!!!” Obviously, writing Puppet code barely scratches the surface of Ops’ work and skillsets, but hopefully this post has at least helped demystify that particular aspect. I also don’t mean to say it’s remotely practical to step outside your role and job description to learn a brand new and (kind of) unrelated technology, because it’s not. It happened to make a lot of sense for us and we were very fortunate to be supported in this endeavor.
This project has made our job slightly easier because we no longer have to do a lot of manual work that we needed to before. And if we need to replace a dashboard server, we just launch a new instance, assign it the role we wrote, and Puppet takes care of everything. We are also working with the Release Engineering team to add continuous integration for our internal R packages, and that endeavor uses the r_lang module we wrote for this project. Furthermore, learning Puppet has empowered us to make (small) changes when we need to (such as making new software libraries available on our analytics cluster), rather than assigning them to someone else and waiting for our turn in their to-do queue.
Lastly, on behalf of the Discovery Analysis team, I would like to give a special thanks to our former data analyst Oliver Keyes for creating the dashboards, to Search Platform’s Ops Engineer Guillaume Lederrey for being an exceptional teacher and guide, and to Deb Tankersley, Chelsy Xie, and Melody Kramer for their invaluable input on this post.
Mikhail Popov, Data Analyst
Wikimedia Foundation

Can you help us translate this article?
In order for this article to reach as many people as possible we would like your help. Can you translate this article to get the message out?
Start translation