Average core blocks of the Great Pyramid weigh about 1.5 tons each, and the granite blocks used to roof the burial chambers are estimated to weigh up to 80 tons each. Photo by Mgiganteus1, freely licensed under CC BY-SA 3.0.
Phragile is a tool that generates burn down charts, burn up charts and sprint oberviews for the Phabricator boards of agile software projects. It supports scrum masters, product managers, and agile software development teams in their daily work.
Below, we unpack and explain those terms, along with showing why Wikimedia Deutschland (Germany) worked together with the Wikimedia Foundation to develop the tool.
Once upon a time in Ancient Egypt
A long time ago, writing software was not unlike building a pyramid in Ancient Egypt. There was a plan and a monumental goal and it was carried out to the end, never taking a detour from what was planned.
But as software has taken a greater and greater importance in everyday life, it became apparent that software projects should not be treated like pyramids. Until you start building, sometimes you don’t understand that what you really want is not a pyramid but rather something else. Sometimes there are new requirements from those who actually commissioned the building that make you refocus. For today’s challenges in software development, teams of experts that actively collaborate are much more likely to produce meaningful results than people being commanded to carry out a grand plan as an unskilled worker. And last, not least, wouldn’t it be nice to have a report on the tasks for this week instead hoping that after years of hard labor the pyramid will finally come together?
In software development, we call methods that deal with collaboration in a potentially rapidly changing world agile. Agile software development is a group of software development methods in which requirements and solutions evolve through collaboration between self-organizing, cross-functional teams. It promotes adaptive planning, evolutionary development, early delivery, continuous improvement, and encourages rapid and flexible response to change.
Stories, Scrum, and Burndown Charts
When we started to develop Wikidata at Wikimedia Deutschland in Berlin in April 2012, it was clear from the very beginning that we had to follow these agile principles and prepared a scrum board in our office. A scrum board is a to-do list that covers your wall with tasks that can be put on it with post-it stickers. Very much like in the game of rugby, scrum is when the players (or software developers) pack closely together with their heads down and attempt to gain possession of the ball—or in our case, the goals of the software project.
Development in scrum style is usually done in fixed time-frames of one or two weeks to stay focused on feasible tasks. Such a time-frame is called a sprint. Doing everything the wiki way, we maintained stories and epics in a wiki. Stories and epics are an important part of agile development: A story describes a change for the better in the software from the perspective of a user (“As a Wikidata editor, I want to do this in order to do that“) and many stories make up an epic with a larger theme, such as a user interface overhaul. Bugs and tasks were maintained in Bugzilla. That was not optimal, so we looked for alternatives to better manage our agile processes.
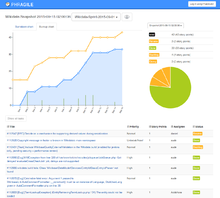
The one major thing we were missing were burndown and burnup charts for the sprint. As a sprint progresses, tasks get finished by the developers. As tasks and stories usually have points—according to how difficult they are—a sprint may start with 100 points and by Wednesday 50 of them are already finished. A burndown chart shows how these points “burn down” during the sprint as a graph. This is both a motivation for the team and a great tool to see how fast you go in solving problems in the sprint. Sometimes you may also want a different visualization of where you are in the sprint: Instead of showing a downwards vertical line approaching zero, things may become clearer by showing an upwards vertical line that approaches the total number of points in the sprint. Such a graph is appropriately called a burnup chart.
That’s how we discovered Scrumbugz and, after some struggles with the confusing setup, started using it for burndown charts and reports. When the Wikimedia Foundation replaced Bugzilla with Phabricator Maniphest in late 2014, we needed to think again about how we could best visualize our sprints and how to automatically generate burndown charts from the sprint boards in Phabricator.
That’s how Phragile got started.
Enter Phragile
Phragile’s main goal is to add a visualization and aggregation layer on top of Phabricator. It dynamically generates sprint overviews including burnup, burndown and status distribution charts for Phabricator projects.
Phragile was initially developed by Jakob Warkotsch as a bachelor thesis project at Freie Universität Berlin in cooperation with the software engineering department of Wikimedia Deutschland. During the initial development phase, Jakob was advised by Abraham Taherivand (Head of Software Engineering) and Tobias Gritschacher (Scrum Master). Later the project was taken over by a software development team at Wikimedia Deutschland. After the demo of the first working prototype in March 2015 the Wikimedia Foundation and Wikimedia Deutschland worked together on a shared vision of Phragile and came up with a roadmap of features that would fulfill the additional requirements of the WMF. A lot of valuable feedback was gathered during the MediaWiki Hackathon in Lyon in May which allowed both parties to sit together in person to discuss and hack on new Phragile features. The collaboration resulted in several great additions like burnup charts, chart data export, automatic snapshots of chart data and automated deployments on Wikimedia Labs.
Currently Phragile is deployed on Wikimedia Labs and is used by the product management and the Scrum Master of Wikimedia Deutschland in several software projects such as Wikidata and by the team that works on the technical wishes list. The Wikimedia Foundation requested to enable several projects on Phragile such as Wikipedia-iOS-App or WikidataQueryService.
Phragile is under active development and will further evolve over the next year. One big upcoming feature would be to support and visualize user stories. An overview of Phragile’s currently supported features can be found on GitHub and a roadmap of upcoming features is available on Phabricator.
With Phragile, we have successfully developed a tool to make our software development more agile. It is our hope that teams across the Wikimedia movement will make use of it as we never intended it to be just used as an in-house tool for our specific needs. After all, developing software in a way that is less like building a monumental pyramid and more agile as it is necessary today is something that connects coders all across technical contributors to Wikimedia projects.
Tobias Gritschacher (WMDE), Jakob Warkotsch (WMDE), Jens Ohlig (WMDE)
Wikimedia Deutschland

Can you help us translate this article?
In order for this article to reach as many people as possible we would like your help. Can you translate this article to get the message out?
Start translation


