Running the fifth largest website in the world brings its own set of challenges. One particularly important issue is the time it takes to render a page in your browser. Nobody likes slow websites, and we know from research that even small delays lead visitors to leave the site. An ongoing concern from both the Operations and Platform teams is to improve the reader experience by making Wikipedia and its sister projects as fast as possible. We ask ourselves questions like: Can we make Wikipedia 20% faster on half the planet?
As you can imagine, the end-user experience differs greatly due to our unique diverse and global readership. Hence, we need to conduct real user monitoring to truly get an understanding of how fast our projects are in real-life situations.
But how do we measure how fast a webpage loads? Last year, we started building instrumentation to collect anonymous timing data from real users, through a MediaWiki extension called NavigationTiming.[1]
There are many factors that determine how fast a page loads, but here we will focus on the effects of network latency on page speed. Latency is the time it takes for a packet to travel from the originating server to the client who made the request.
ULSFO
Earlier this year, our new data center (ULSFO) went fully operational, serving content to Oceania, South-East Asia, and the west coast of North America[2]. The main benefit of this work is shaving up to 70−80ms of round-trip time for some regions of Oceania, East Asia, US and Canada. An area with 360 million Internet users and a total population of approximately one billion people.
We recently explained how we chose which areas to serve from the new data center; knowing the sites became faster for those users was not enough for us, we wanted to know how much faster.
Results
Before we talk about specific results, it is important to understand that having faster network round trip times might not directly result in a faster user experience for users. When network times are faster, resources are retrieved faster, but there are many other factors that influence page latency. This is perhaps better explained with an example: If we need 4 network trips to compose a page, and if round trips 2, 3 and 4 are happening while I am parsing a huge main document (round trip 1), I will only see improvements from the first request. Subsequent ones are done in parallel and totally hidden under the fetching of the first one. In this scenario, our bottleneck for performance is the parsing of the first resource. Not the network time.
With that in mind, what we wanted to know when we analyzed the data from the NavigationTiming extension were two things: How much did our network times improve? and Can users feel the effect of faster network times? Are pages perceived to be faster, and if so, how much?
The data we harvest from the NavigationTiming extension is segregated by country. Thus we concentrated our data analysis on countries in Asia for which we had sufficient data points; we also included the United States and Canada but we were not able to extract data just for the western states. Data for United States and Canada was analyzed at a country level and thus the improvements in latency appear “muffled”.
How much did our network times improve?
The short summary is: network times improved quite a bit. For half of requests, the retrieval of the main document decreased up to 70 ms.

In the opposite graph, the data center rollout is marked with a dashed line. The rollout was gradual, thus gains are not perceived immediately but they are very significant after a few days. The graph includes data for Japan, Korea and the whole SE Asia Region.[3]
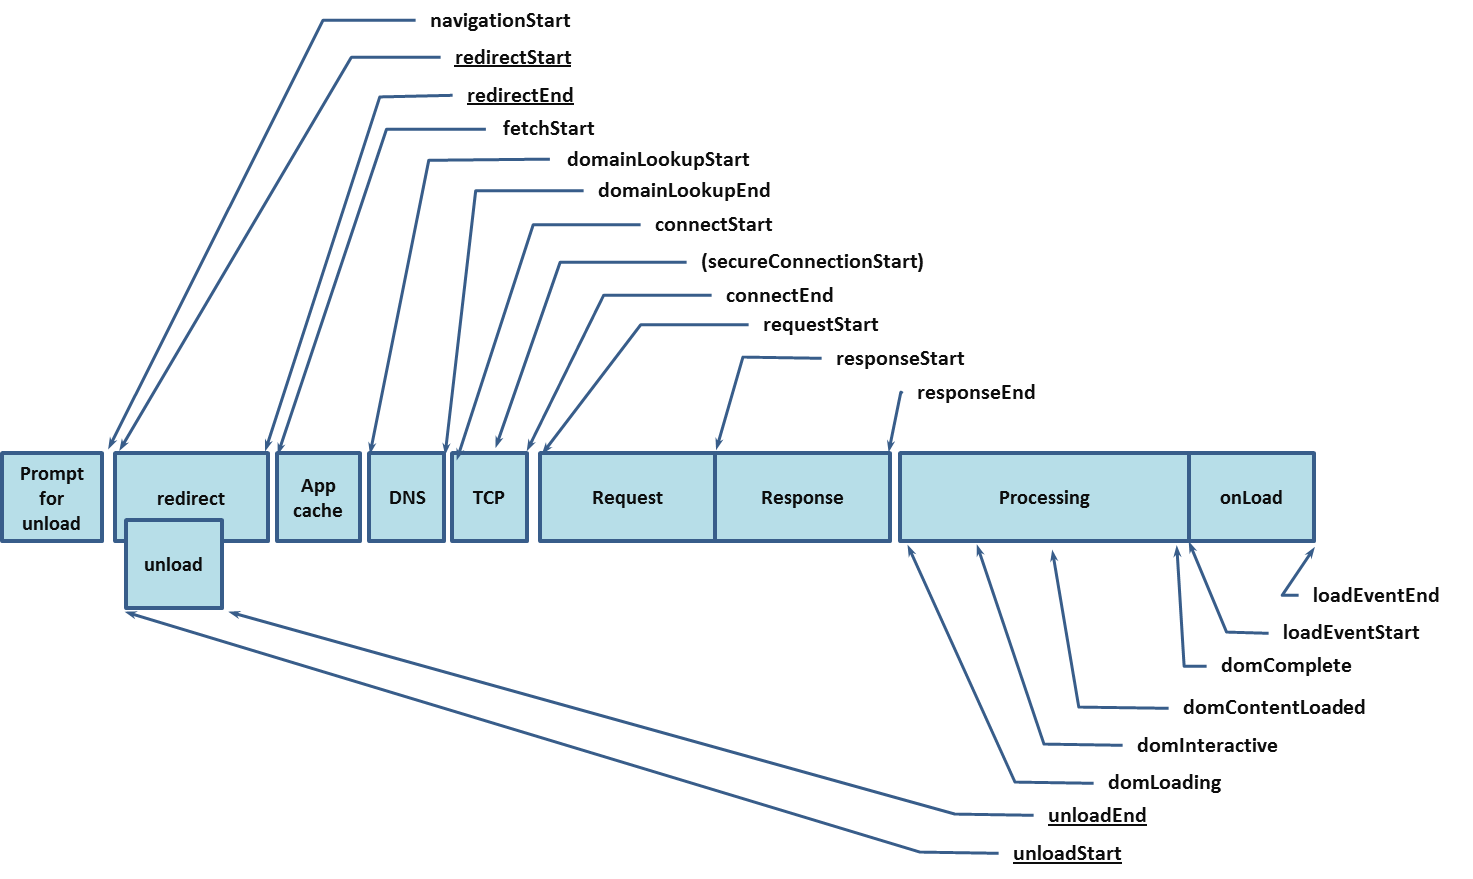
We graphed the responseStart–connectStart time which represents the time spent in the network until the first byte arrives, minus the time spent in DNS lookups. For a more visual explanation, take a look at the Navigation timing diagram. If there is a TCP connection drop, the time will include the setup of the new connection. All the data we use to measure network improvements is provided by request timing API, and thus not available on IE8 and below.
User perceived latency
Did the improvement of network times have an impact that our users could see? Well, yes it did. More so for some users than others.
The gains in Japan and Indonesia were remarkable, page load times dropped up to 300ms at the 50th percentile (weekly). We saw smaller (but measurable) improvements of 40 ms in the US too. However, we were not able to measure the impact in Canada.
The dataset we used to measure these improvements is a bigger one than the one we had for network times. As we mentioned before, the Navigation Timing API is not present in old browsers, thus we cannot measure, say, network improvement in IE7. In this case, however, we used a measure of our creation that tells us when a page is done loading called mediaWikiLoadComplete. This measure is taken in all browsers when the page is ready to interact with the user; faster times do mean that the user experience was also faster. Now, how users perceive the improvement has a lot to do with how fast pages were to start with. If a page now takes 700 ms to render instead of one second, any user will be able to see the difference. However a difference of 300 ms in a 4 second page rendering will be unnoticed by most.
.png)
Want to know more?
Want to know all the details? A (very) detailed report of the performance impact of the ULSFO rollout is available.
Next steps
Improving speed is an ongoing concern, particularly as we roll out new features and we want to make sure that page rendering remains fast. We are keeping our eyes open to new ways of reducing latency, for example by evaluating TCP Fast Open. TCP Fast Open skips an entire round-trip and starts sending data from the server to client before the final acknowledgment of the three-way TCP handshake has been finished.
We are also getting closer to deploying HipHop. HipHop is a virtual machine that compiles PHP bytecode to native instructions at runtime, the same strategy used by Java and C# to achieve their speed advantages. We’re quite confident that this will result in big performance improvements on our sites as well.
We wish you speedy times!
Faidon Liambotis
Ori Livneh
Nuria Ruiz
Diederik van Liere
Notes
- ↑ The NavigationTiming extension is built on top of the HTML5 component with same name which exposes fine-grained measurements from the moment a user submits a request to load a page until the page has been fully loaded.
- ↑ Countries and provinces served by ULSFO include: Bangladesh, Bhutan, Hong Kong, Indonesia, Japan, Cambodia, Democratic People’s Republic of Korea, Republic of Korea, Myanmar, Mongolia, Macao, Malaysia, Philippines, Singapore, Thailand, Taiwan, Vietnam, US Pacific/West Coast states (Alaska, Arizona, California, Colorado, Hawaii, Idaho, Montana, New Mexico, Nevada, Oregon, Utah, Washington, Wyoming) and Canada’s western territories (Alberta, British Columbia, Northwest Territories, Yukon Territory).
- ↑ Countries include: Bangladesh, Bhutan, Hong Kong, Indonesia, Japan, Cambodia, Democratic People’s Republic of Korea, Republic of Korea, Myanmar, Mongolia, Macao, Malaysia, Philippines, Singapore, Thailand, Taiwan, Vietnam.
Can you help us translate this article?
In order for this article to reach as many people as possible we would like your help. Can you translate this article to get the message out?
Start translation